Data Science From Scratch - A Book Review
Books are amazing, aren't they? An expert pours all the knowledge he's accumulated over the long years of his career into the pages of a book, all of which you can read and learn in a tiny fraction of the time. It blows my mind.
That said, I have to admit that don't typically pick up STEM books (if I want to learn something technical I'll generally do a course), but after having read this one, I think I'll make more of an effort.
The book in question.
Being something of a Data Science hobbyist - I've gone through a couple courses and done a handful of projects - I thought I'd check out Data Science From Scratch by Joel Grus, one of the more popular beginner books on the subject. I'm a relative DS newbie with some pretty significant knowledge gaps, so I'm well within the book's target audience.
I've divided this review into 2 parts - part 1 is just a short overview, and if you want the gist then you can read that part. Part 2 is a chapter-by-chapter breakdown of the book, which I did because A) attempting to describe what I learn in my own words helps the concepts stick better, and B) because maybe someone wants a reaaally thorough idea of what the book is about.
Review 1 - The Short One
Who The Book is For
People who want to learn Data Science, who already have some Python experience. There's a chapter on Python, but you want to be at least a little comfortable with it before diving in.
What The Book is About
Data Science, from A to Z, from scratch. There are 27 chapters, each dedicated to a specific area of Data Science - from Python and Data Visualisation to Neural Nets and Deep Learning, with Linear Algebra, Stats and a whole bunch of other stuff in between.
The book implements eveeerything in Python, even the database examples. If you want to follow along with the coding (and you really do), the github page for the book can be found here.
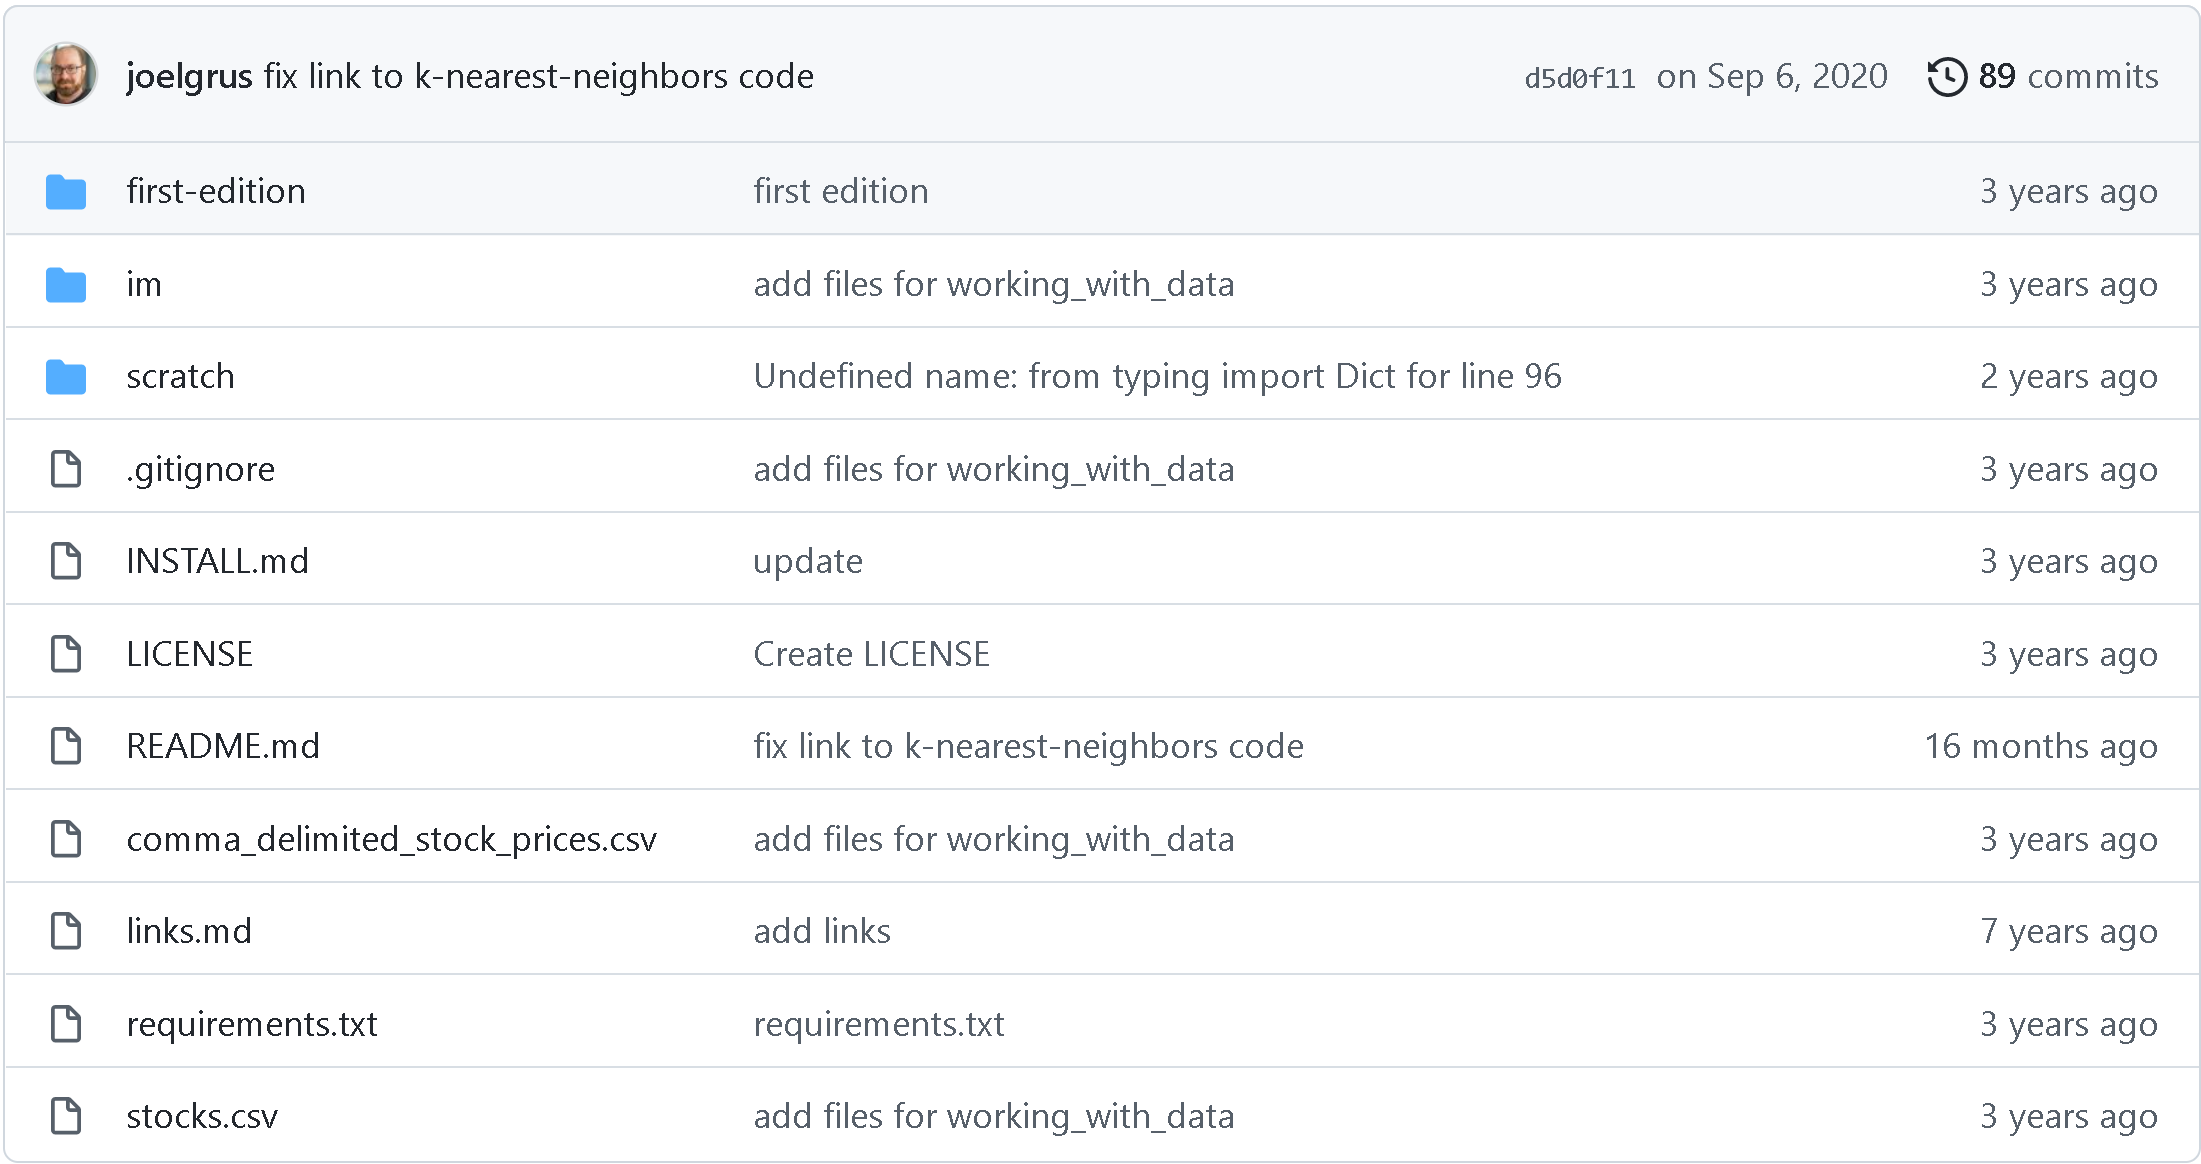
All of the code examples from the book in one place
I spent about 25 hours going through the book, and I'd say that if you were really coming to Data Science from scratch and running/messing around with every piece of code (which I didn't always do), you could add a bunch more time to that estimate.
What I liked
It's comprehensive in terms of the topics touched on. It's a resource that exposes you to the full breadth (note - not depth) of the Data Science field. For some reason, I find mentally reassuring to be able to see the "limit" of a given topic, if just for confirmation that it's not actually an infinitely wide subject.
The python code examples are frequent and illustrative. Rather than relying on numpy, pandas or other libraries, the author uses vanilla python that well illustrate the concepts discussed, thus justifying the “from scratch” part of the title and keeping the barrier to entry low.
Even though it's dealing with a technical topic, I think it's a pretty approachable book, doesn't get too heavy (though there's some math notation and a bunch of code), and it's written in a light, sometimes humorous style.
What Could Be Improved
I’d have liked to have seen more pictures that illustrate the more complicated concepts, which sometimes is what’s required to really "get" an idea, at least for me.
It would have been nice to see more visualisations like this - Source.
Also, I'd have liked to have had more concrete explanations as to how exactly some of the subjects tie into Data Science. For example, the book notes that Linear Algebra underpins much of Data Science and Machine Learning, but the book doesn't really go into detail as to why, though you do get a sense of its function as the book progresses.
Conclusion
I liked Data Science From Scratch - reading this book will give you a good overview of what Data Science entails, and hopefully pique your curiosity enough to go and search out other, more in-depth resources for each of the subjects touched upon. You can pick it up on Amazon here.
</Review 1 - The Short One>
Ok. Ready to read, like, 4500 more words worth of review? Yes? Alrighty, let's continue...
Review 2 - The Long One
What follows is a rundown of each chapter, along with 1 thing I learned from it, and an interesting extract from the book itself.
Chapter 1 - Introduction
The first chapter runs through a hypothetical day in the life of a Data Scientist, which is written as a kind of microcosm of the book's various subjects, in more or less the order they're approached in. It's motivating stuff to be able to have an idea of what you'll (hopefully) be able to do at the end of the book.
1 Thing I learned
Nothing just yet.
Interesting Tidbit
A data scientist is someone who knows more statistics than a computer scientist and more computer science than a statistician.
Chapter 2 - A Crash Course in Python
Second chapter is a quick intro to Python, though if you’re not already familiar with Python then you’d definitely need accompanying resources, which the author acknowledges. There are a bunch of code examples, and if you’re new to Python then it'd probably be a good idea to run/tinker with these examples to get a bit more of a feel for it.
If this isn't complete gibberish to you then you're probably good to go.
1 Thing I learned
Type annotations - declaring what kind of variable a variable is going to be, which the book makes heavy use of throughout it. It was a bit odd to me at first, given that I had no exposure to static typing before, but I got used to looking at it after a while and even started to appreciate the added clarity.
Interesting Tidbit
If you were a bad person, you could import the entire contents of a module into your namespace, which might inadvertently overwrite variables you’ve already defined. However, since you are not a bad person, you won’t ever do this.
Chapter 3 - Visualizing Data
Chapter 3 is a fairly brief chapter that goes into data visualisation w/ Matplotlib, just long enough to describe the basics, best practices on bar charts, line charts and scatter plots. It is noted that Matplotlib, while still used, is starting to show its age, and at the end of the chapter notes some alternatives - though not Plotly, which I think also deserves a mention.
1 Thing I learned
A minor thing, but not starting off the y-axis at 0 can be misleading and is better avoided.
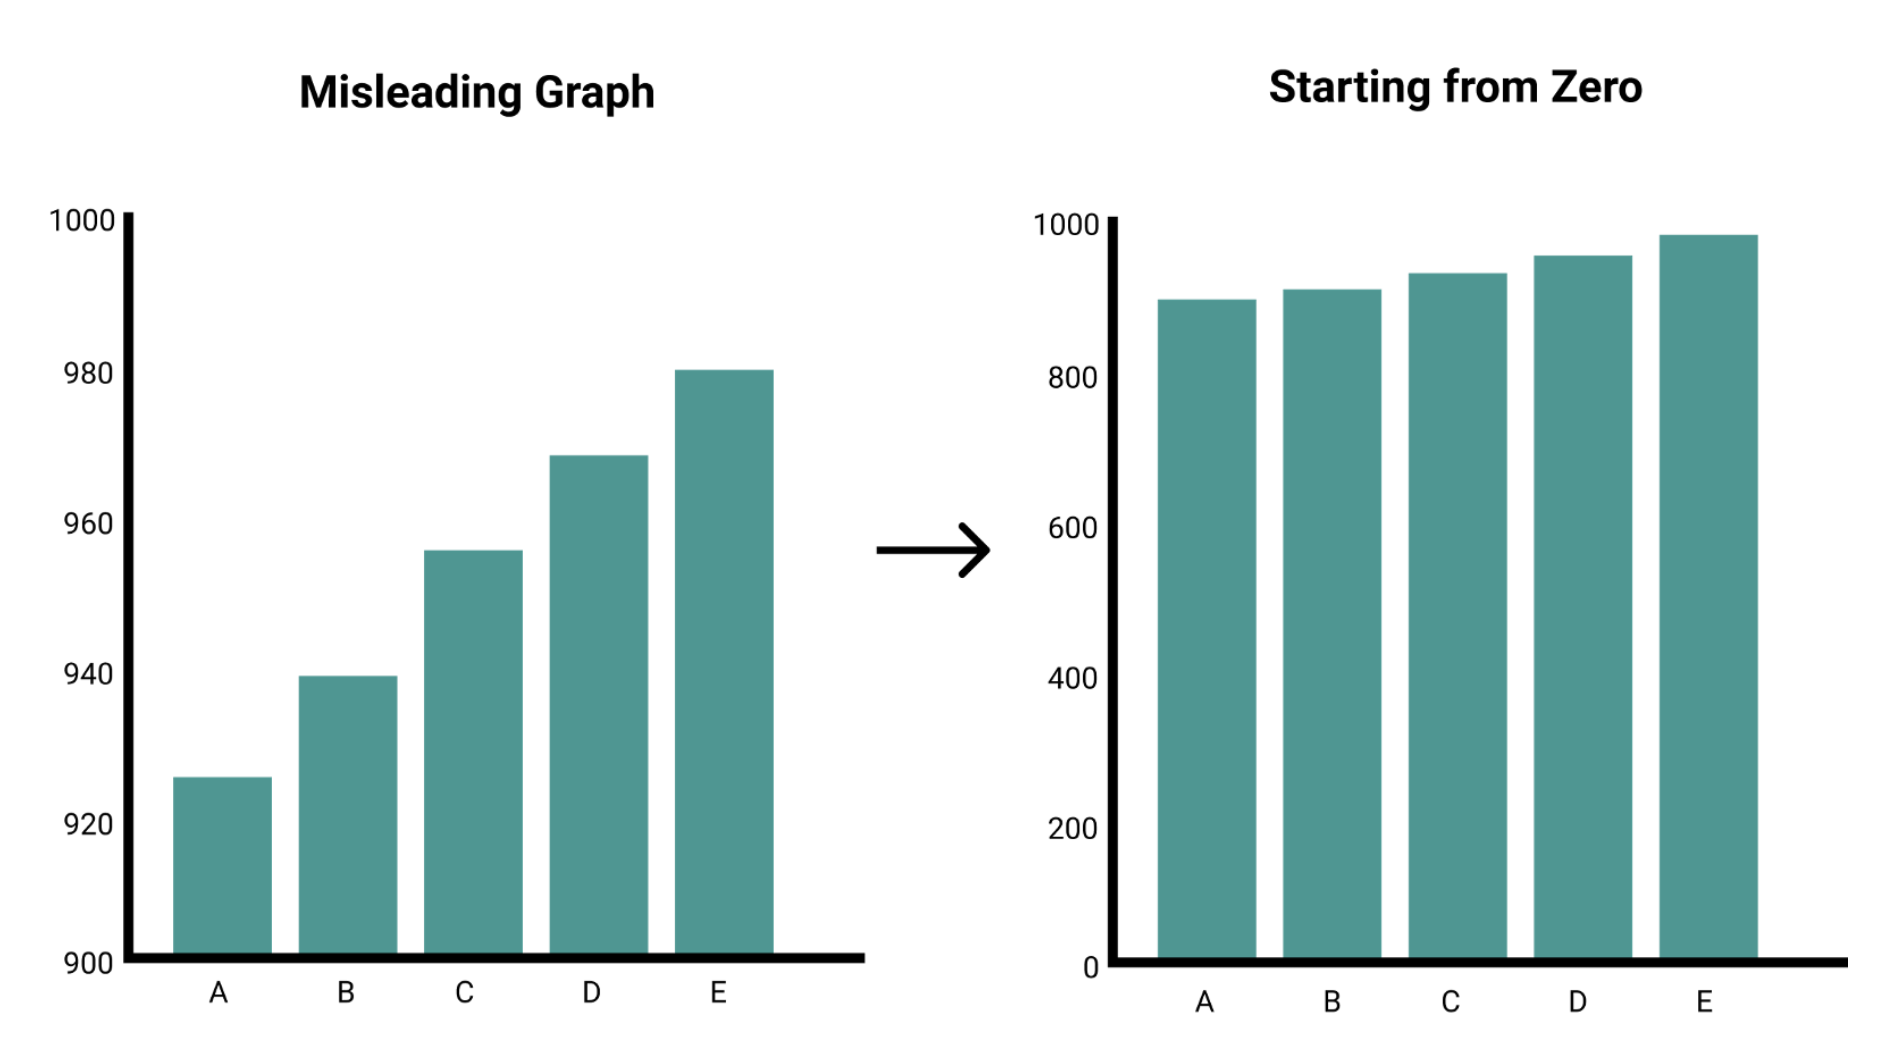
Something like this is a no-no - Source.
Interesting Tidbit
The matplotlib Gallery will give you a good idea of the sorts of things you can do with matplotlib (and how to do them).
Chapter 4 - Linear Algebra
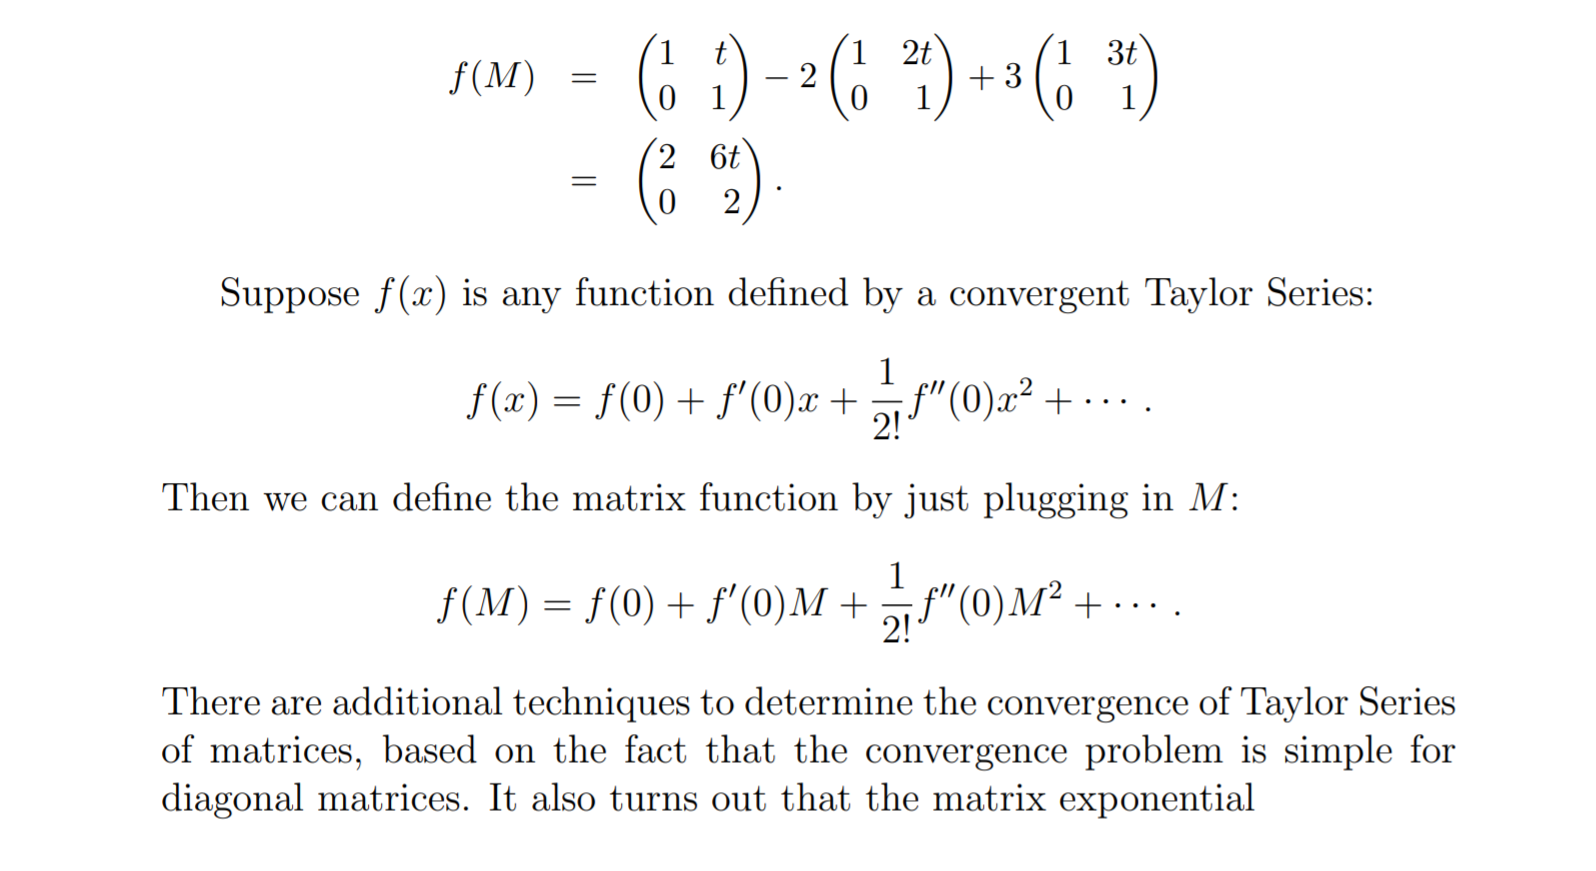
Chapter 4 is a primer on Linear Algebra, a necessarily brief one given how vast the subject is. As the author notes, it’s simply not possible to cover everything within one chapter, but as with the other chapters, he notes a bunch of resources to look at to dive deeper into the subject.
Anyway, here we learn what vectors are, what matrices are and some of their properties. As I noted in the short review, here I'd have liked a more thorough explanation on how exactly Linear Algebra is involved in the Data Science process.
1 Thing I learned
That a vector's magnitude is the same as its length (Linear Algebra expert over here!). Looks like I'll be consulting the recommended resources at the end of the chapter...
Once I've got time for a spot of light reading - Source.
Interesting Tidbit
Vectors add componentwise. This means that if two vectors v and w are the same length, their sum is just the vector whose first element is v[0] + w[0], whose second element is v[1] + w[1], and so on.
Chapter 5 - Statistics
Chapter 5 goes over statistics, running through the basics of mean/median/mode, correlation, randomized trials, Simpson’s Paradox, the effect of outliers on a dataset, etc. A bit more basic than the Linear Algebra chapter (or possibly I’m just more familiar with stats), but a good overview nonetheless.
Compared to the Linear Algebra chapter, I felt that this chapter was clearer on why statistics are important to the Data Science process.
1 Thing I learned
I didn't know that metrics like standard deviation, variance and range come under the banner of "Dispersion", or how spread out the data in a dataset is.
Interesting Tidbit
If x and y are strongly correlated, that might mean that x causes y, that y causes x, that each causes the other, that some third factor causes both, or nothing at all.
Chapter 6 - Probability
Chapter 6 is on probability, again a large subject, one that the author notes can be something of a rabbit hole. This chapter goes into a good amount of detail, by the end of it you’re looking at fairly intimidating looking probability notation and are able to make some sense of it.
This chapter covers dependence/independence, conditional probability, Baye’s theorem, random variables, expected values, distributions, Boulloui trials, binomial random variables and the Central Limit Theorem.
There’s a couple cool examples of probability in this chapter, one involving a family with 2 children of unknown gender - if all you know is that at least one of the children is a girl, then it is not far from twice as likely that the family has one boy and one girl than that it has both girls. The author proves this using code, and I ran it myself to verify the results, but still...this just seems like black magic to me.
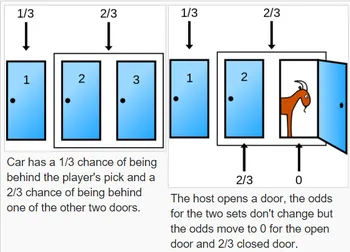
For other probability puzzles that break my brain, please see the Monty Hall problem - Source.
1 Thing I learned
The definition of a "Bernoulli trial" - that being a random experiment with only 2 possible outcomes whose probability doesn't change across different experiments. A coin flip, for example, is a Bernoulli trial.
Interesting Tidbit
Imagine a population of 1 million people. You’d expect 100 of them (with a disease which affects 1 in 10,000 people) to have the disease, and 99 of those 100 to test positive. On the other hand, you’d expect 999,900 of them not to have the disease, and 9,999 of those to test positive. That means you’d expect only 99 out of (99 + 9999) positive testers to actually have the disease.
Chapter 7 - Hypothesis and Inference
Chapter 7 is on Hypothesis and Inference. It is the first chapter (excluding the Python chapter) that really starts building on knowledge from previous chapters, using what was learned in the stats and probability chapters to show how hypothesis testing works. It’s primarily from a frequentist perspective, though Bayesian testing is included as well, noting that it’s not without its detractors.
It goes through significance levels, confidence intervals, p-hacking and A/B tests. It can get pretty dense in places, so make sure you’ve properly understood the preceding 2 chapters.
1 Thing I learned
Continuity Correction - the idea of rounding figures in a continuous distribution to map to discrete figures. For example, say you're calculating the probability of somebody being 185cm in height in a normally distributed population of people, with an average height of 180cm. As you're trying to map the discrete figure of 185cm to the continuous data of the population, you would include an extra .5cm (or .499999cm...etc to be super precise) to the 185cm figure (184.5-185.5), as this is a closer approximation to 185cm than 185-186 is. 185.75cm, for example, is closer to 186cm.
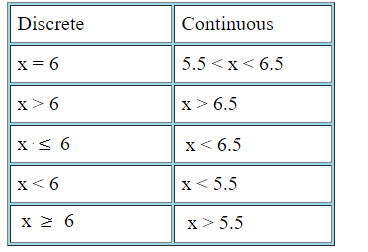
I think this is one of those "a picture's worth a 1000 words" scenarios - Source.
Interesting Tidbit
The annals of bad data science are filled with examples of people opining that the chance of some observed event occurring at random is one in a million, when what they really mean is “the chance, assuming the data is distributed normally,” which is fairly meaningless if the data isn’t.
Chapter 8 - Gradient Descent
8th Chapter is on Gradient Descent, a subject that gets pretty dense by the end. It covers partial derivatives, difference quotients, choosing the right step size, mini and stochastic batch gradient descent.
I feel like this chapter suffers from the same issue as the Linear Algebra chapter, in that we’re told that Gradient Descent is important and are given a brief explanation as to why, but for beginners coming into Data Science cold, I don’t know that it would be enough. Adults have to understand why they're learning something in order to really get it.
That said, I can't rule out the possibility that I just need pictures like this to learn stuff and nobody else actually has this problem - Source.
1 Thing I learned
Minibatch and Stochastic gradient descent are both descent techniques I hadn't heard of, the later being a thorough but computationally expensive technique, the former being a balance (both in terms of precision and computing complexity) of Stochastic descent and the regular "batch" variety.
Interesting Tidbit
One approach to maximizing a function is to pick a random starting point, compute the gradient, take a small step in the direction of the gradient (i.e., the direction that causes the function to increase the most), and repeat with the new starting point.
Chapter 9 – Getting Data
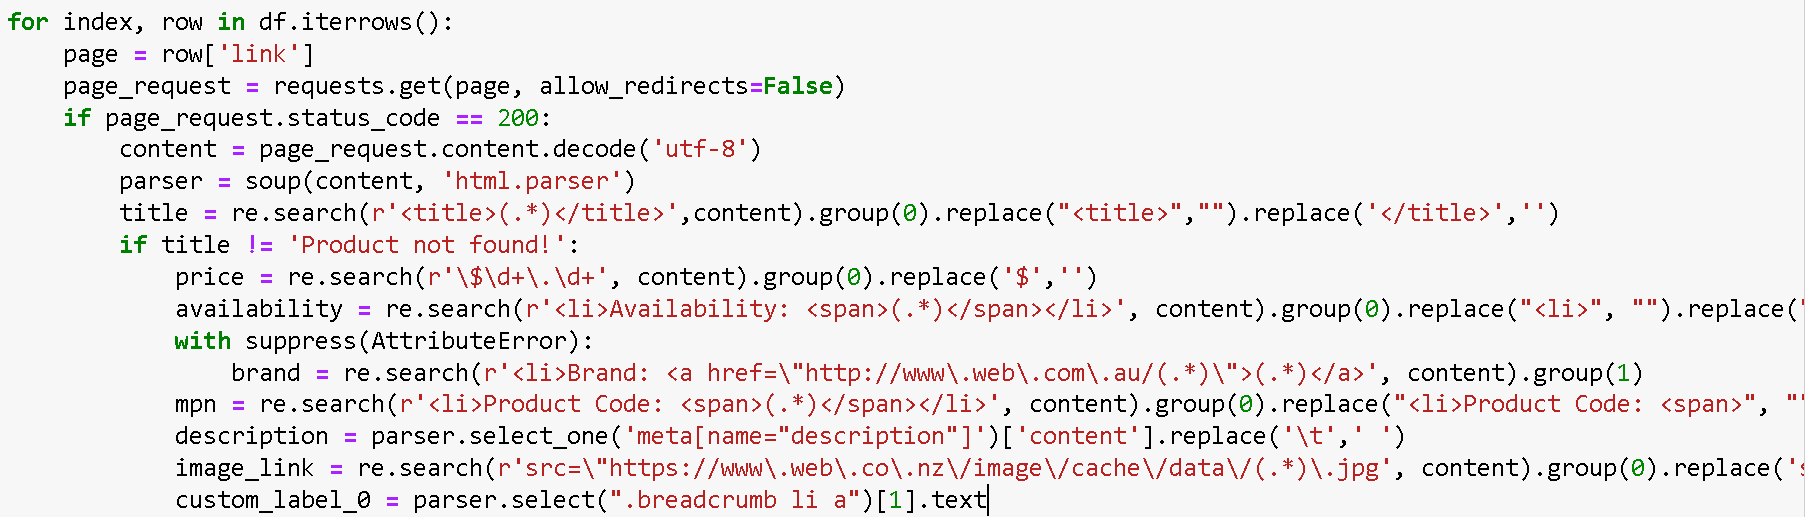
Chapter 9 touches on gathering data, reading files using (vanilla) Python, working with delimited data, using web scraping (w/ Beautiful Soup + Requests), and accessing APIs using the example of Twitter. This chapter a fair bit gentler difficulty wise than the previous handful.
1 Thing I learned
Having never used the Twitter API, I hadn't previously heard of Twython, a Python library for getting Twitter data.
Interesting Tidbit
Most sites will have a robots.txt file that indicates how frequently you may scrape the site (and which paths you’re not supposed to scrape).
Chapter 10 – Working with Data
Chapter 10 goes through working with the data, starting from basic histograms of 1-dimensional data through to scatterplot matrices for many dimensions. It also touches briefly on data cleaning - dealing with bad or missing data, how to handle outliers, as well as data scaling, giving a good example of how scale can be changed, depending on the measurements used (in this case, inches vs centimeters).
The tqdm library wasn’t something I was familiar with, so that was a nice little discovery.
1 Thing I learned
Principal Component Analysis (PCA) as a means of reducing the dimensionality (and thus complexity) of a dataset. This allows you to, among other things, speed up ML training, and potentially allow you to visualise data in 2D or 3D.
Interesting Tidbit
If there’s one bad row out of millions, it’s probably okay to ignore it. But if half your rows have bad data, that’s something you need to fix.
Chapter 11 – Machine Learning
We finally get to the fun part in chapter 11, as we start to dip our toes into Machine Learning. It’s a pretty gentle intro, introducing concepts such as modelling, ML model types, over/under fitting, precision vs recall, the bias-variance tradeoff, features and the effect of adding/removing them to the model’s effectiveness. This chapter does a good job of whetting the appetite to dive deeper into the various ML models.
1 Thing I learned
While I'd heard of the 2 metrics precision and recall (the accuracy of the positive predictions, and the percentage of total, respectively), I hadn't heard of the F-score, that being a combination of the 2 metrics.
Interesting Tidbit
A common danger in machine learning is overfitting — producing a model that performs well on the data you train it on but generalizes poorly to any new data.
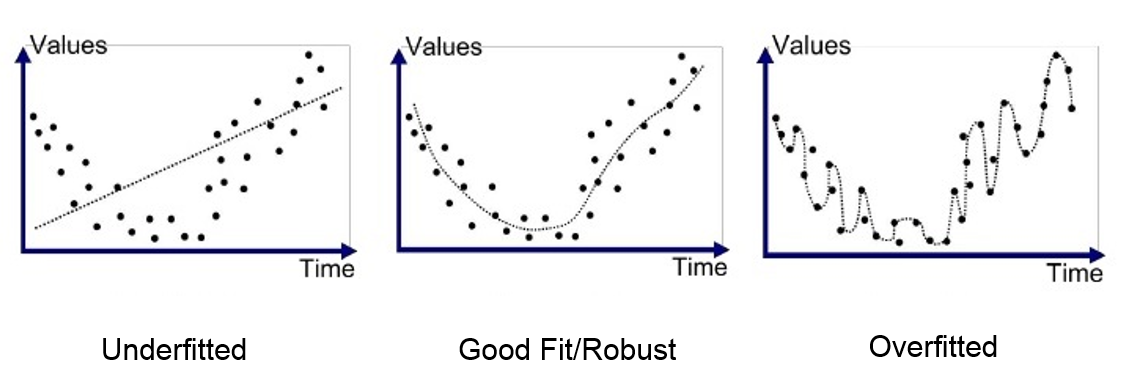
An example of overfitting a model to data - Source.
Chapter 12 – K-Nearest Neighbors
Chapter 12 goes through the K-Nearest Neighbors algorithm, a good starting point for getting to grips with ML models. It shows how this algorithm does fairly well with lower dimension datasets (such as the Iris dataset) but struggles with higher dimension datasets, where there may not be very many close neighbors at all due to their size.
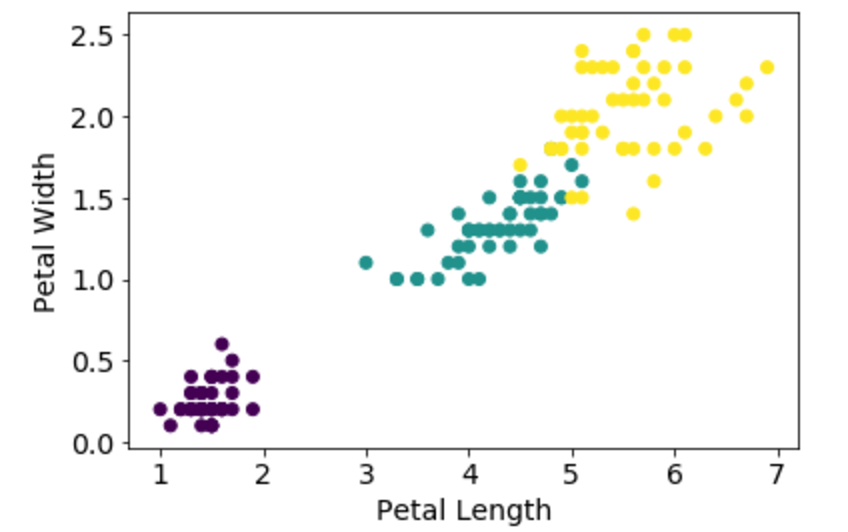
K-Nearest Neighbors applied to the Iris dataset - Source.
1 Thing I learned
The idea that Nearest Neighbors by definition doesn't do great with higher dimension data - as Nearest Neighbors works on data points being close to each other, having 3 or more dimensions increases the average space between them - so, as far as neighbors go, they aren't very...near.
Interesting Tidbit
Nearest Neighbors is one of the simplest predictive models there is. It makes no mathematical assumptions, and it doesn’t require any sort of heavy machinery. The only things it requires are: 1) some notion of distance, and 2) an assumption that points that are close to one another are similar.
Chapter 13 – Naïve Bayes
Chapter 13 goes over the Naïve Bayes algorithm, noting its imprecise but useful nature (particularly as a spam filter) and difficulties in handling 0, or numbers close to 0. We go through creating a simple model (using custom code, which the author notes is the same algo as in the sci-kit learn library) and running it through the Spam Assassin corpus, a nice little project to get a feel for how it works.
1 Thing I learned
The existence of the Porter Stemmer, a function that reduces words to its stem, removing endings like -ing, -ed, etc, with the goal to help improve model accuracy.
Interesting Tidbit
The key to Naive Bayes is making the (big) assumption that the presences (or absences) of each word are independent of one another, conditional on a message being spam or not.
Chapter 14 – Simple Linear Regression
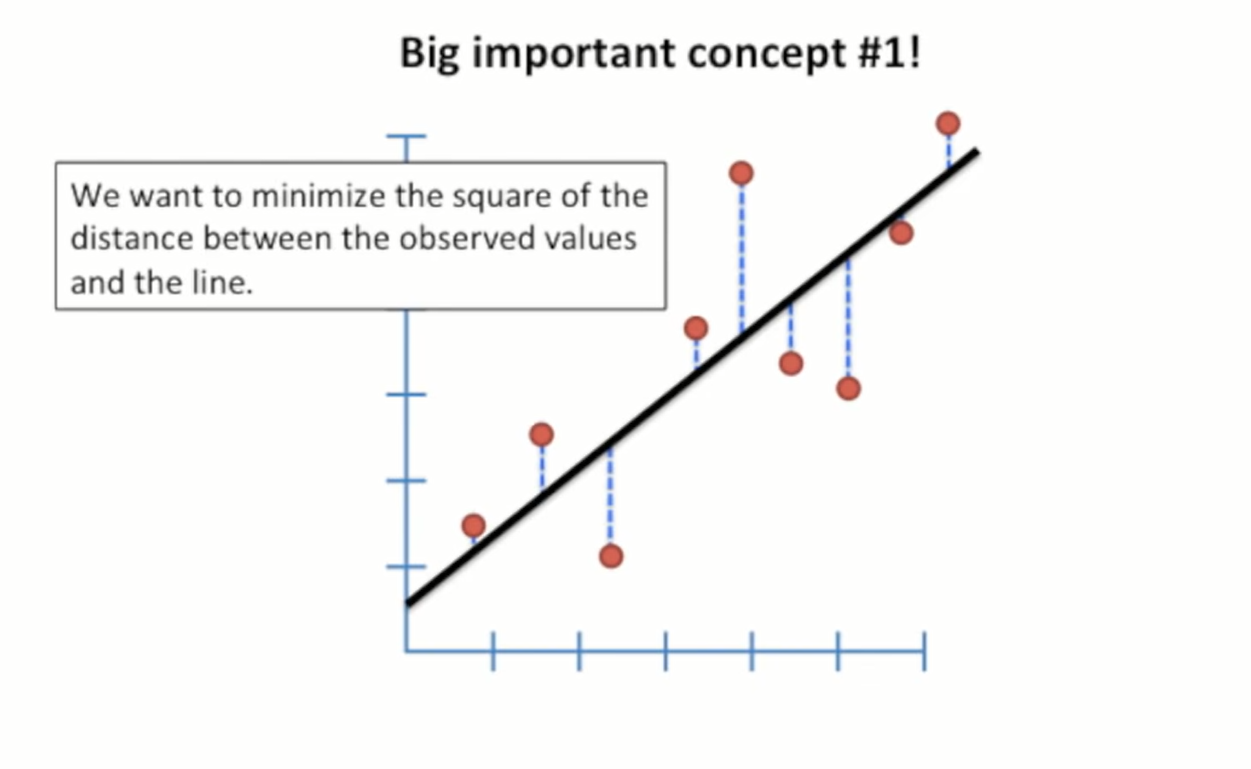
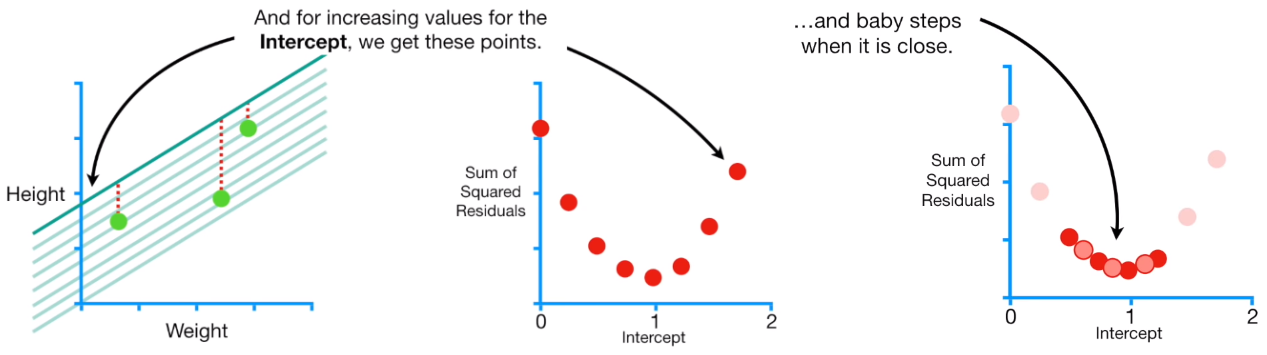
Chapter 14 deals with simple linear regression, going over things such as how (squared) error is calculated, alpha/beta, r-squared, and using gradient descent to minimise a model’s error. This is a shorter chapter than others, a bit dense but not too challenging if you’ve followed along with the other chapters.
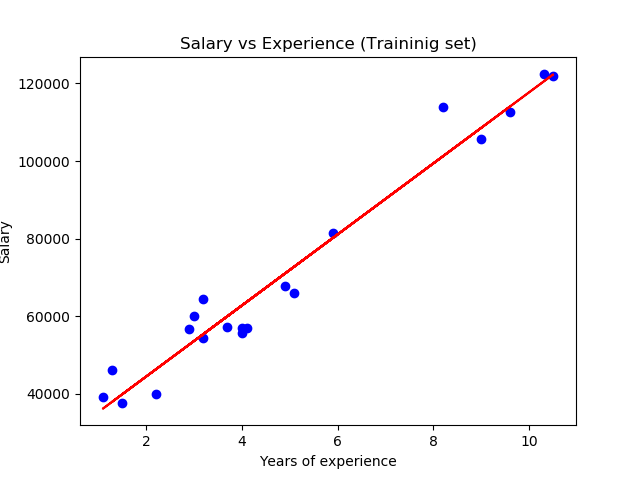
Nice and simple - Source.
1 Thing I learned
Just a little thing, but I had no idea that the intercept could also be called the alpha, or that the coefficient was also called the beta. Still so much to learn...
Interesting Tidbit
Alpha = 22.95 and beta = 0.903. So our model says that we expect a user with n friends to spend 22.95 + n * 0.903 minutes on the site each day. That is, we predict that a user with no friends on DataSciencester would still spend about 23 minutes a day on the site. And for each additional friend, we expect a user to spend almost a minute more on the site each day.
Chapter 15 – Multiple Regression
Chapter 15 goes over Multiple Regression, expanding upon the Linear Regression model from the previous chapter, going over key assumptions of the model, fitting the model to the data using gradient descent, the effects of adding new variables to the R-Squared score (which is to say, it will increase), bootstrapping, and regularization of data. It’s a challenging chapter, one that ends with the recommendation that you further explore the topic with a textbook (or a Wikipedia binge).
1 Thing I learned
Bootstrapping! I thought this was just a made-up Silicon Valley word that had something to do with start-ups, but it's also a statistics term for selecting random data points with replacement from a single dataset to create many samples, it's actually quite useful!
Interesting Tidbit
The more nonzero coefficients you have, the harder it is to make sense of them. If the goal is to explain some phenomenon, a sparse model with three factors might be more useful than a slightly better model with hundreds.
Chapter 16 – Logistic Regression
Chapter 16 is a short chapter that goes over Logistic Regression and classification models in general, using it as a solution for modelling who in the hypothetical DataSciencester social network is likely to pay for a premium account. The chapter also briefly touches on SVMs (Support Vector Machines) as a classification alternative, though doesn’t go into detail.
1 Thing I learned
The kernel trick - converting data that you want to separate into a higher dimensional state so a clear line of separation appears, which is a technique for the Support Vector Machine algorithm.

In other words, this - Source.
Interesting Tidbit
It’s hard (and probably not a good idea) to use support vector machines without relying on specialized optimization software written by people with the appropriate expertise
Chapter 17 – Decision Trees
Chapter 17 is about Decision Trees using the ID3 algorithm, noting their strengths (easy to interpret, transparent, can handle both categorical and regression problems) and weaknesses (computationally expensive, easy to overfit).The chapter goes over the topic of entropy (a way of measuring the uncertainty of data), the components of a tree (decision nodes, leaves), Random Forests as a way to counteract overfitting (Random Forests essentially being a bunch of decision trees), and ensemble learning generally.
1 Thing I learned
Bagging - Using different, bootstrapped data to train each tree within your random forest to avoid having your model overfit the data. A pretty cool technique I gotta say.
Interesting Tidbit
Decision trees can easily handle a mix of numeric (e.g., number of legs) and categorical (e.g., delicious/not delicious) attributes and can even classify data for which attributes are missing.
Chapter 18 – Neural Networks
Chapter 18 covers neural networks, from a single perceptron to networks with multiple layers, covering feed-forward networks and back-propogation. The author gives the intentionally silly example of using a neural network to solve the Fizz Buzz coding challenge. While definitely overkill, it’s a good example of how Neural Networks can solve problems.
1 Thing I learned
Lots - this is an interesting chapter and I knew nothing about Neural Networks - but one thing is the idea of backpropagation, a powerful technique for training Neural Networks by adjusting the weights and biases of the network based on its output, gradually making smaller and smaller adjustments until the model is trained.
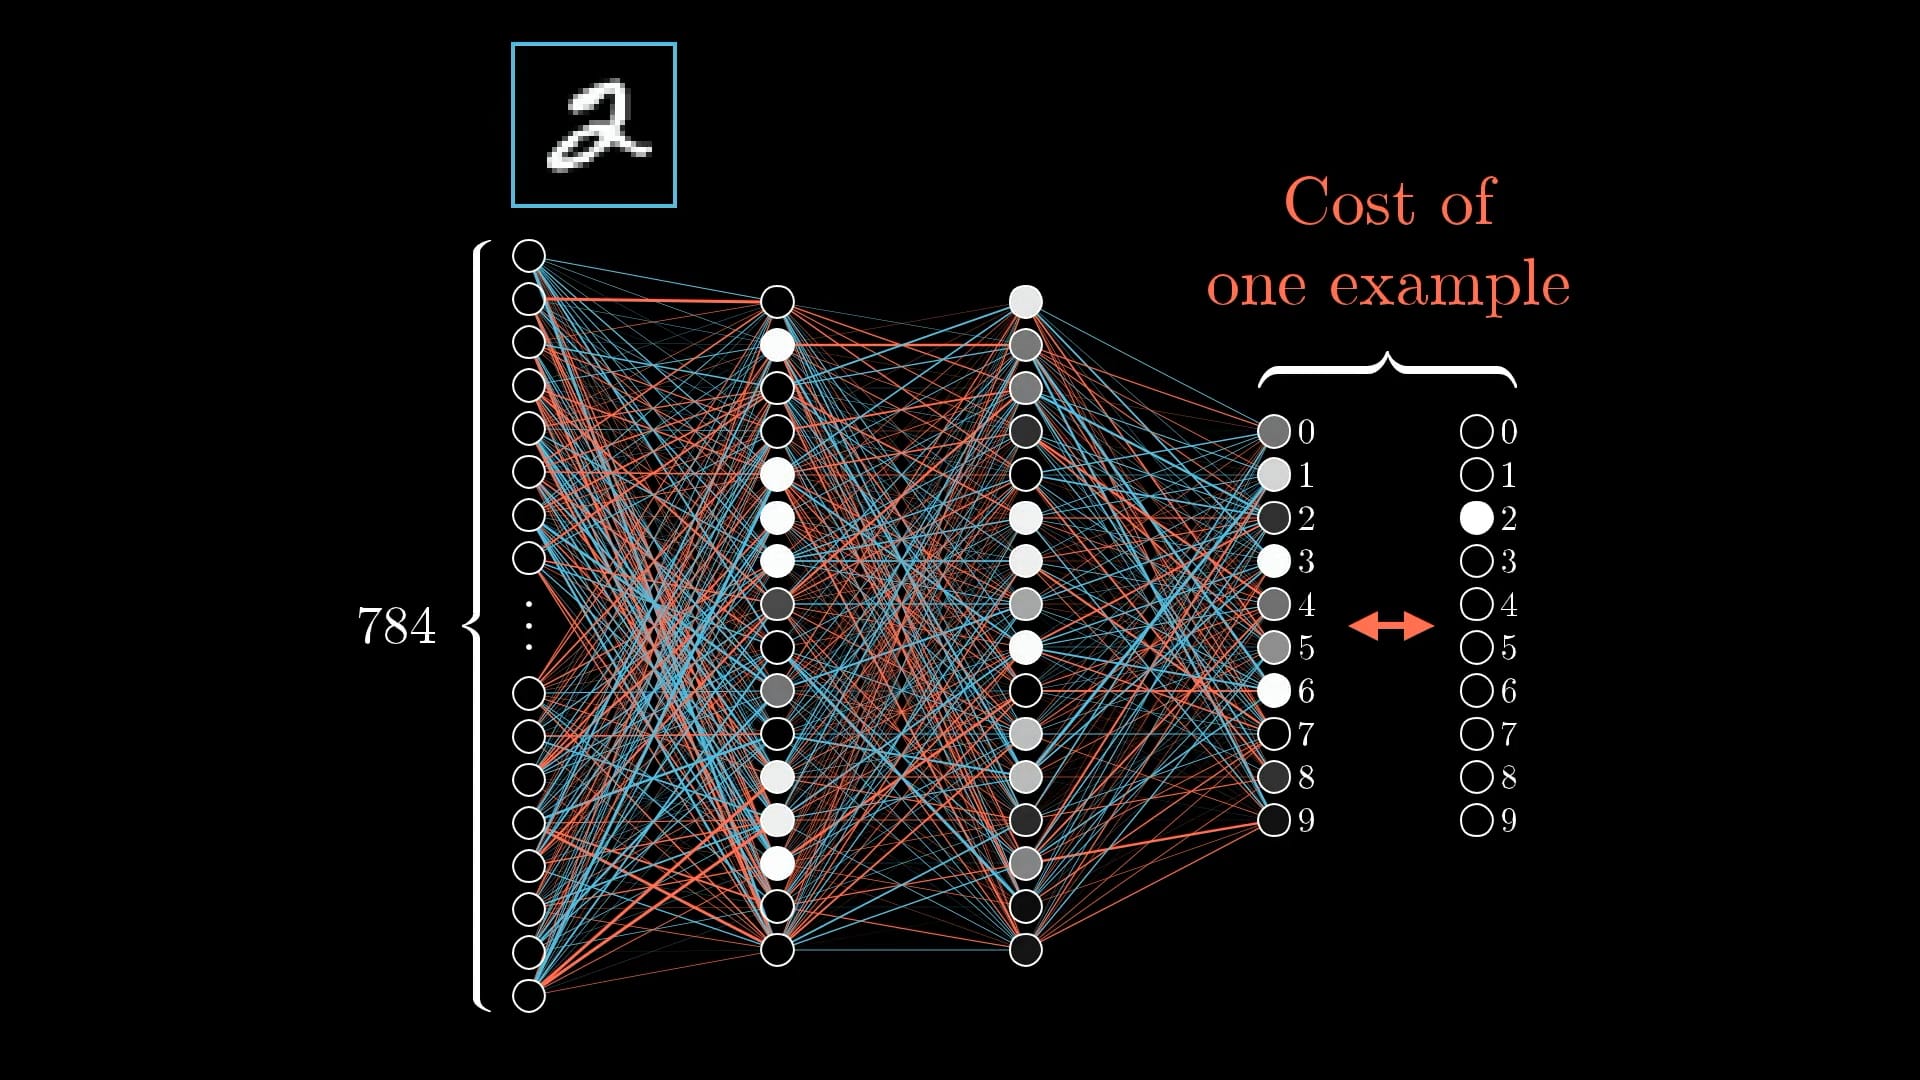
3Blue1Brown has crazy good visualisations on how backpropagation works - Source.
Interesting Tidbit
Most neural networks are “black boxes” — inspecting their details doesn’t give you much understanding of how they’re solving a problem.
Chapter 19 – Deep Learning
Following on from chapter 18’s neural nets, chapter 19 is on Deep Learning, going over things like tensors, layer abstraction, the various possible activation functions (sigmoid, tanh, Relu) and regularization using dropout.
It's at this point in the book that, at least for me, things get pretty heady...in a good kind of way, like my mind is expanding to figure out these new concepts.
1 Thing I learned
What Tensors are - essentially, they are n-dimensional data containers, particularly those ≥ 3 dimensions. If I understand correctly, vectors and matrices are themselves kinds of tensors, but they're 1-dimensional/2-dimensional respectively, so to avoid confusion you'd just refer to them as vectors and matrices.
Interesting Tidbit
Deep learning originally referred to the application of “deep” neural networks (that is, networks with more than one hidden layer), although in practice the term now encompasses a wide variety of neural architectures.
Chapter 20 – Clustering
Chapter 20 covers clustering, a non-supervised ML method, unlike the previous ML techniques covered before. It covers the k-means method, and the various methods in which you can go about choosing k (the number of clusters), which can get quite involved and doesn’t really have a “right” answer.
1 Thing I learned
Among other things, the various ways to decide how to cluster your data - you can 1) manually decide on a number of clusters and work from there, you can use 2) "bottom-up" clustering, where every data point starts as its own cluster and you merge the 2 closest clusters together iteratively until you have the number you want (stopping before all the data is in 1 giant cluster), or you can 3) plot the sum of squared errors between every data point in your set and the mean of its cluster to see where a good balance is between the amount of total error and the total number of clusters.
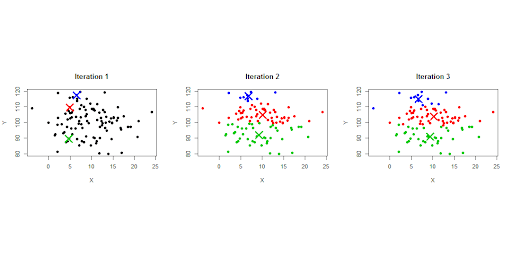
What a set of data might look like after a few iterations of k-means - Source.
Interesting Tidbit
Unlike some of the problems we’ve looked at, there is generally no “correct” clustering. An alternative clustering scheme might group some of the “unemployed millennials” with “grad students,” and others with “parents’ basement dwellers.”
Chapter 21 – Natural Language Processing
Chapter 21 is on Natural Language Processing (NLP), going over everything from Word Clouds, n-gram language models, grammars and their role in both generating and understanding text, latent Dirichlet allocation for identifying common topics, word vectors and their ability to handle synonyms and similar words, all the way to combining NLP with recurrent neural networks. It's probably the densest, longest chapter in the book, but it's fascinating stuff.
1 Thing I learned
A bunch of stuff (again a really interesting topic), probably the core of which being grammars, which are basically rules for generating and analysing text - grammars for verbs, prepositions, nouns, various combinations of these in the one rule, etc.
Interesting Tidbit
Typically the word vector for big is pretty close to the word vector for large, so that a model operating on word vectors can (to some degree) handle things like synonymy.
Chapter 22 – Network Analysis
Chapter 22 focuses on Network Analysis, a topic that I previously didn’t have the fogginess notion of, touching on themes such as centrality, betweenness centrality, closeness centrality, Eigenvector Centrality and more.
1 Thing I learned
Nothing specific, just the whole idea of centrality/connectedness and how it can be measured is a new concept to me, one that still breaks my brain with how circular/recursive it seems.
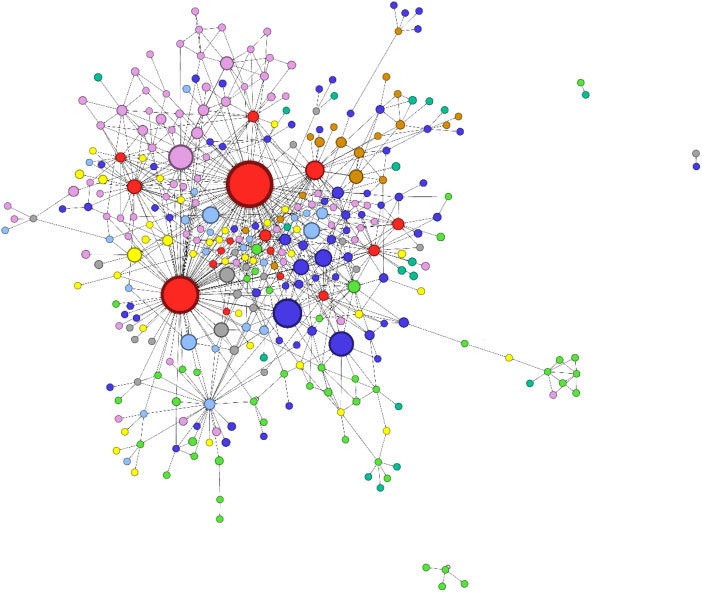
Makes for cool looking visualisations though - Source.
Interesting Tidbit
Centrality means being connected to people who themselves are central. The more centrality you are directly connected to, the more central you are. This is of course a circular definition — eigenvectors are the way of breaking out of the circularity.
Chapter 23 – Recommender Systems
Chapter 23 focuses on recommender systems, such as Amazon’s product suggestions or Netflix’s recommendation algorithm, going over the various ways of going about recommending things, from manual curation, broadly popular items, and analysing users with similar behaviour/interests using cosine similarity.
1 Thing I learned
The idea that similarity based recommendations get less and less reliable the larger the number of items grow, as the “Interesting Tidbit” below demonstrates.
Interesting Tidbit
Imagine a site like Amazon.com, from which I’ve bought thousands of items over the last couple of decades. […] Whoever my “most similar” shopper is, he’s probably not similar to me at all, and his purchases would almost certainly make for lousy recommendations.
Chapter 24 – Databases and SQL
Chapter 24 is on databases/sql, which is implemented in Python, in keeping with the “From Scratch” concept of the book. CREATE TABLE/INSERT/UPDATE/etc are all implemented as methods, which gives a good appreciation of how SQL might work under the hood.
1 Thing I learned
That noSQL databases like MongoDB is based on json, not tables.
Interesting Tidbit
A relational database is a collection of tables, and of relationships among them. A table is simply a collection of rows
Chapter 25 – MapReduce
Chapter 25 is a fairly short chapter on MapReduce, which is apparently out of date (again - and I feel like this is a running theme of this review - I knew next to nothing about MapReduce before this chapter) but still interesting to learn about, particularly as it pertains to reducing calculation time for “sparse” matrices (matrices with loooots of zeros).
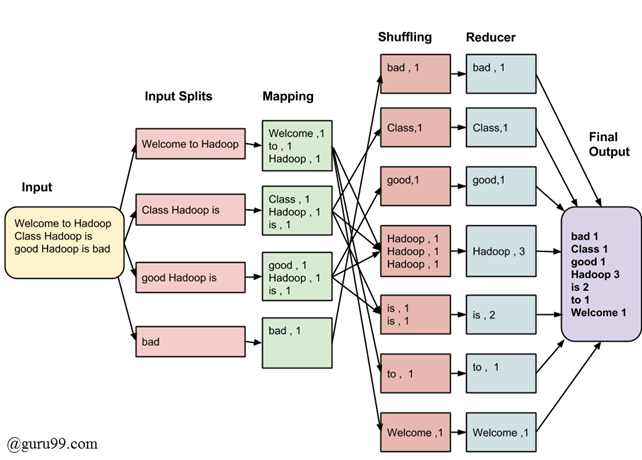
The MapReduce process, in a nutshell - Source.
1 Thing I learned
That there’s a thing called a Combiner – this optional process further improves MapReduce performance by combining identical data into a single instance, before the Reduce part of the algorithm handles it.
Interesting Tidbit
Large matrices are sometimes sparse, which means that most of their elements equal 0. For large sparse matrices, a list of lists can be a very wasteful representation. A more compact representation stores only the locations with nonzero values.
Chapter 26 – Data Ethics
Chapter 26 deals with the murky question of Data Ethics. It’s a short chapter, but it brings up quite a few interesting examples, highlighting that ethics within DS is still an open question. If nothing else, it made me curious to look at the recommended resources to dig deeper into the topic.
1 Thing I learned
This chapter opened my eyes to the fact that data ethics is complicated, nuanced, and far from settled.
Interesting Tidbit
Your parole model may do a perfect job of predicting which released criminals get rearrested, but if those rearrests are themselves the result of biased real-world processes, then your model might be perpetuating that bias.
Chapter 27 – Go Forth and Do Data Science
The last chapter is on next steps for learning (Math, various libraries like Pandas and Numpy, data visualisation, Deep Learning, etc), finding data from various data sources (data.gov, Reddit, Amazon, Kaggle, Dataset Search) and some project ideas.
1 Thing I learned
That Amazon had free datasets to play with (https://aws.amazon.com/opendata/open-data-sponsorship-program/)
Interesting Tidbit
Looking through data catalogs is fine, but the best projects (and products) are ones that tickle some sort of itch.
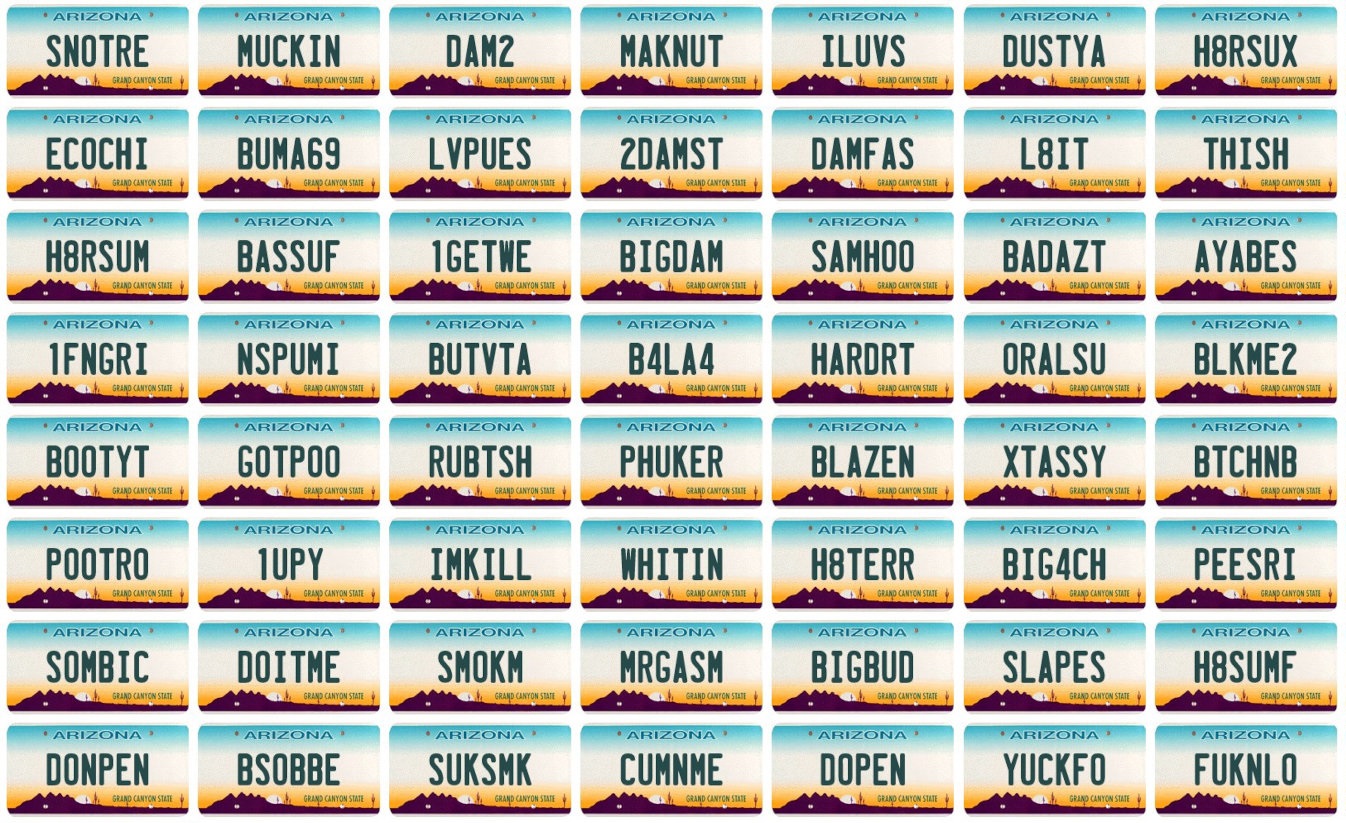
Like using Deep Learning to create offensive number plates, for example - Source.
Conclusion
Think of the book as a launching pad – you go through the chapters and learn the concepts, and for anything you don’t understand/want to explore further, you go off and find other resources that cover the same concepts in either more detail or in a different format (video, for example). When I got stuck on a concept, Statquest and 3Blue1Brown (both YT channels) were both very helpful in fleshing it out, but I wouldn't have even known what to look for without this book.
As I wrote in the intro, it astounds me how much information can be stuffed into a book, and this one is no exception. For the price (I paid 27 euros for the Kindle edition) I consider the book well worth picking up, which you can do here.
Over to You
Have you read this book? Do you have any other book recommendations for Data Science, Programming, Math or a related subject? Was this obnoxiously long review actually helpful? Let me know!